MediBot: The Conversational AI Healthcare Chatbot
Omdena's Hyderbad Local Chapter Collaboration with 40 members from across the globe to successfully complete project for Hyderabad Local Chapter India.
- Why do we need a Chatbot in Healthcare?
- So How Do We Proceed?
- Chatbot Modelling Rasa FrameWork:
- Conclusion:
- Future Scope:
- Production Roadmap
- Business Scope and Business Model
- Members Involved in the Project:
- References:
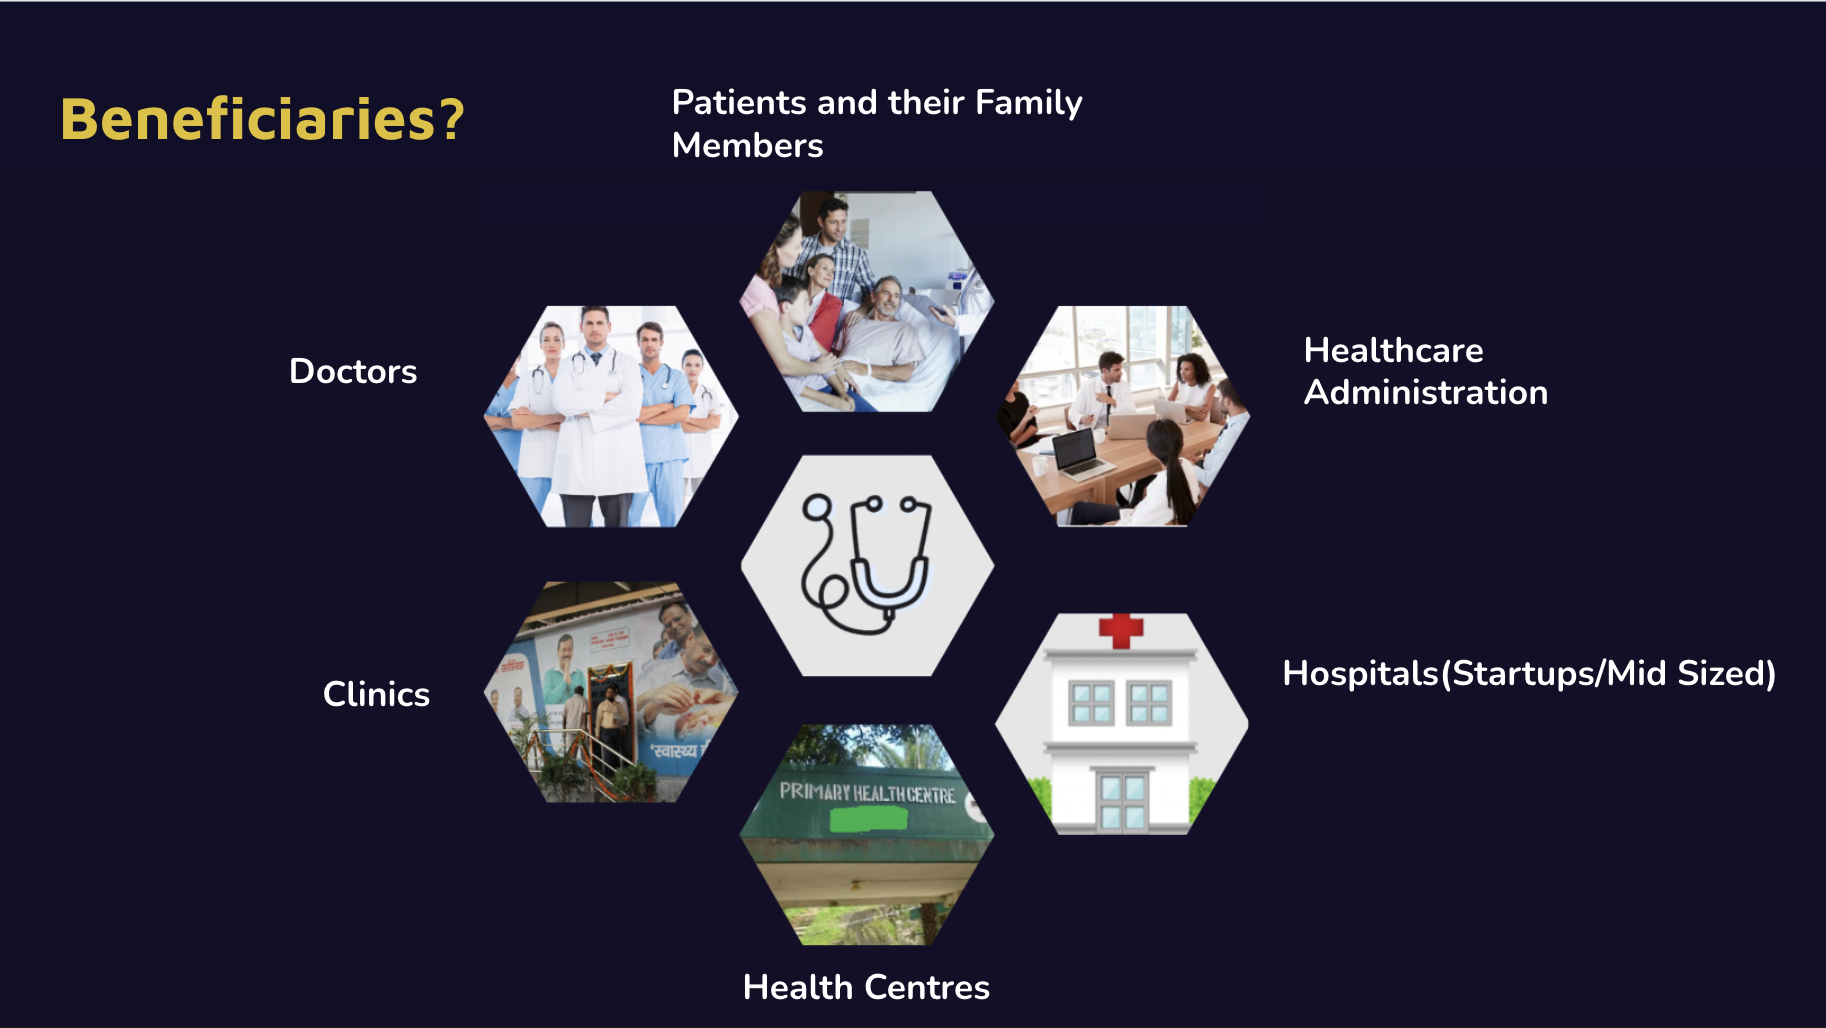
Why do we need a Chatbot in Healthcare?
Patients POV:
-
Too many unanswered queries due to epidemics surges such as Covid etc, unavailability of medical staff and increased traffic in hospital.
-
Heightened Anxiety and Nervousness in patients due to long waiting times, expectation of results leading to patients becoming paranoid .
Medical staff’s POV:
-
Prioritization of patients on the basis of medical emergencies. Eg: The Doctor gives more attention to patients having medical emergencies and poor attention to other patients which lie in the low priority list.
-
Repeated Generic queries by patients leads to duplication of effort.
-
Over occupied medical staff.
This project focuses on solving this issue by creating solutions in multiple forefronts as below:
-
Creating a chatbot to help users get answers at their fingertips
-
Creating a dashboard for users to visualize insights on a particular disease
-
Performing sentiment analysis on the data gathered from responses from patients to visualize the emotions into positive, negative and neutral categories and improve the chatbot experience based on the results.
So How Do We Proceed?
Project Pipeline: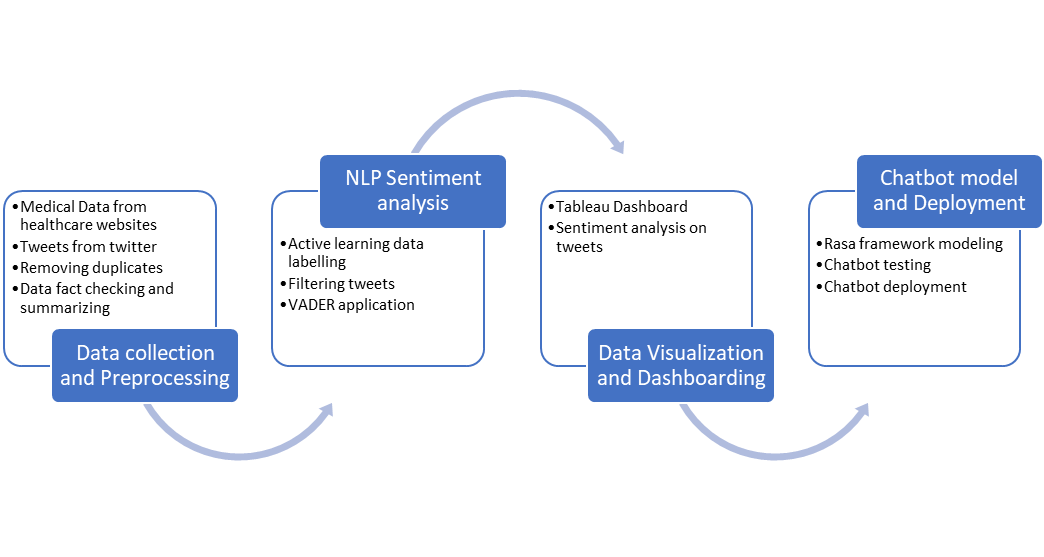
Data Collection and Preprocessing
We began the project by collecting the data necessary for Chatbot and Sentiment Analysis shown on the dashboard. We used web scraping of reliable medical pages to collect the data of 6 diseases to be used as the knowledge base of the chatbot. For each of these files we had individual .csv files with 21 columns of data related to 2nd columns and the 6 diseases used in the first column of the table below:
| Covid | Symptoms (male, female, babies, common, old-people, critical-stage) |
| Diabetes | Treatment ( general, babies, old-people, critical-stage) |
| Respiratory Diseases | Medication (general, babies, old-people) |
| Heart Diseases | Facts or Myths |
| Dengue | Expenses |
| Diarrhoeal Diseases | Funding |
| Survival Rate | |
| Diagnosis | |
| FAQ | |
| Prevention |
After extracting data for each 6 diseases in individual .csv files. We merge the CSV’s to make a single .csv where the diseases are arranged row-wise.
This merged file has some redundancies to deal with, for that we did some preprocessing:
-
Removed the repeated columns which occurred after merging the CSV files of all the Diseases.
-
Removed Unnecessary data in the Survival-Rate Column for better Data Visualization.
-
Removed the Unwanted Symbols from the Data.
-
Fixed Some Spelling Mistakes
-
Added an Extra Column “Condition” to Track the Disease
-
Converted long form of contents to short summaries for the better user experience.
-
Removed the points in each column which a user can’t understand..
For the Patient experience, we used Twitter API to gather tweets collection (Libraries: sns, tweepy). Tweets collected :
-
63239 tweets (without class)
-
29706 tweets (with class)
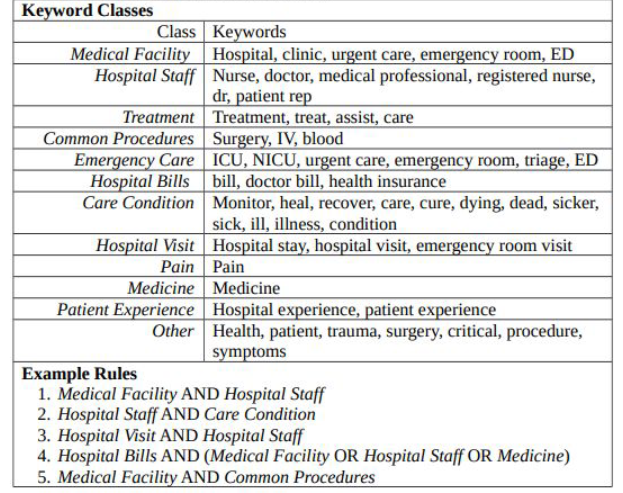
Keywords and Classes used for the extraction of these tweets describes as follows :
Collected Tweets needed a lot of cleaning. Conditions for cleaning are listed below :
-
Non English tweets: A lot of tweets were in languages other than english, since we are considering english as our primary language in the project we removed the non english tweets by using SpaCy - lang_detect function.
-
Hashtags, Mentions: We removed the hashtags and mentions by using the regex library. Many tweets are retweeted so in that case the mention might change but the text would remain the same. So, removing mentions helped us in dealing with retweets.
-
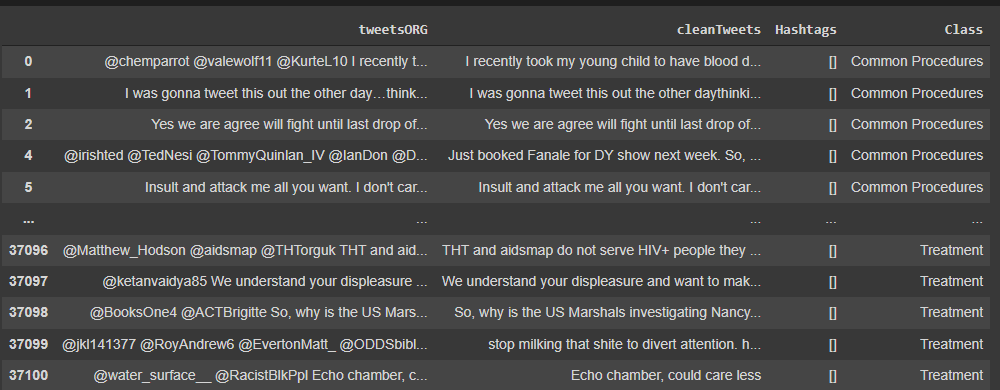
Retweets: Using the cleanTweets column in the dataframe shown below to drop duplicate texts to get only unique tweets
-
URLs: A lot of tweets contained URLs, as per our research most of them turned out to be a promotional tweet or advertisement rather than a patient experience. Thus we removed the URLs.
The dataframe below shows a glimpse of the original tweets, cleaned tweets and their classes:
NLP SENTIMENT ANALYSIS:
-
Sentiment Analysis is the process of determining the emotional tone behind a series of words, used to gain an understanding of the attitudes, opinions, and emotions expressed within an online mention.
-
Here, in our project, we tried to classify the tweets based on the patient’s experience with the overall process during the treatment, such as how did they feel while the treatment, were they scared, nervous, or pretty calm, was the hospital staff helpful, etc.
-
VADER was an excellent way to handle this problem because our data was unlabeled for sentiments. Additionally, the fact that it also deals with preprocessing, acronyms, and emoticons, which may give more insight into properly classifying the data, was a plus.
-
VADER (Valence Aware Dictionary and Sentiment Reasoner) is a lexicon and rule-based sentiment analysis tool that is specifically attuned to sentiments expressed in social media.
-
A sentiment lexicon is a list of lexical features (e.g: words) which are generally labeled according to their semantic orientation as either positive, negative, or neutral. It not only tells about the sentiment score but also tells us about how positive, negative, or neutral a sentiment is.
Steps Performed:
-
Active Learning For Labeling The Data As “Relevant” Or “Irrelevant”
-
Manual Annotation of 14k tweets
-
Use of Active learning for text classification into relevant (patient experience) & irrelevant tweets
-
Libraries: Small-text using Transformer as a classifier
-
HuggingFace
-
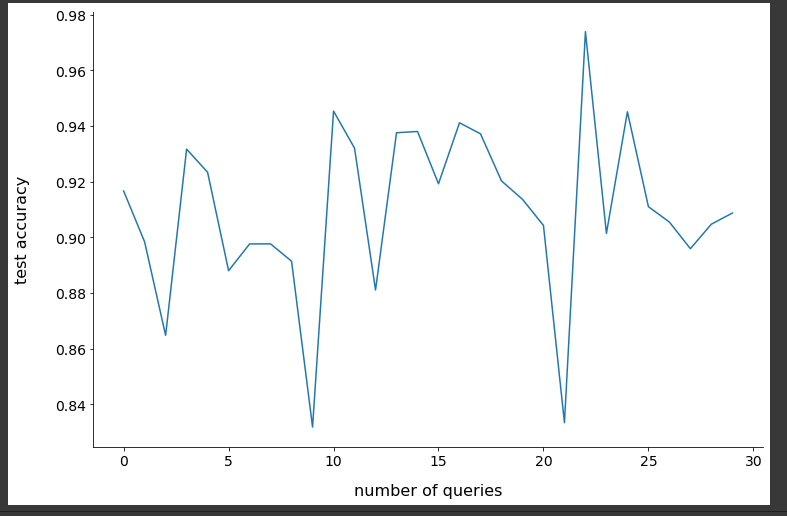
Fig. : Active Learning Graph
-
Filtering The Data To Make The Corpus Customized To The Project Idea
-
The following was the distribution of tweets in the corpus of 62273 tweets
-
Relevant - 23001
-
Irrelevant – 39272
-
-
The irrelevant tweets were those containing any ads/promotions, government schemes or fundraisers, which were later dropped.
-
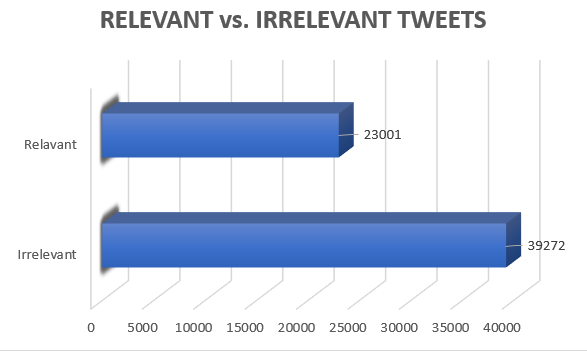
Fig. : Number of Relevant and Irrelevant Tweets
-
Perform Sentiment Analysis For 3 Sentiments Using Vader
-
We used VADER to perform Sentiment Analysis.
-
The data was classified into 3 sentiments namely:
-
Positive
-
Negative
-
Neutral
-
-
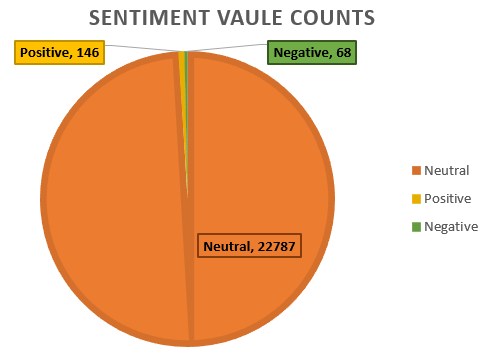
Fig. : Number of tweets classified for each sentiment
-
Visualization using Python
-
Word Clouds:
-
Word Cloud is a data visualization technique used for representing text data in which the size of each word indicates its frequency or importance. In simpler terms, a ‘word cloud’ is a visual representation of word frequency.
-
Word clouds are increasingly being employed as a simple tool to identify the focus of written material. They are widely used for analyzing data from social network websites.
-
-
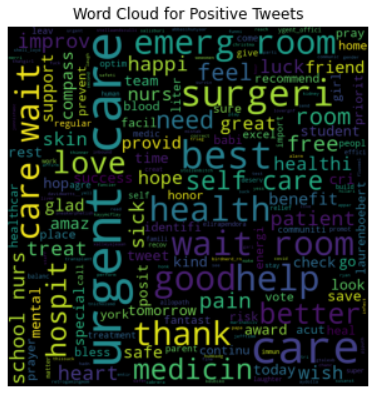
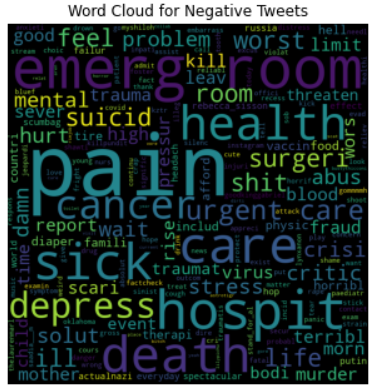
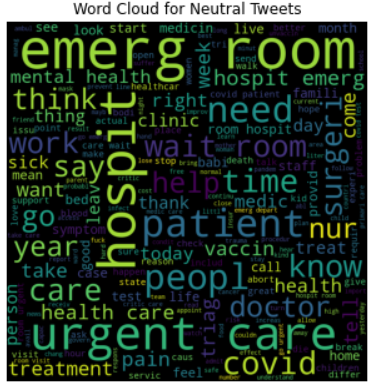
Fig. : Word Cloud for each Sentiments
Data visualization and Dashboarding:
Data visualization, which was once a relatively obscure field, has now become ubiquitous in the fields of business intelligence and data journalism. There are numerous methods for effectively and beautifully presenting insights, as well as a plethora of blogs dedicated to creating and analyzing visualizations. Dashboards are what we utilized to represent data in a variety of ways.
1. Storytelling with Data: Data visualization exists, in large part, to help create a compelling narrative. In the Health Dashboard, we are trying to show the level of data based on the Disease Conditions. Simultaneously, data talks about Sentiment Analysis that is extracted from tweets data.
2. Information is Beautiful: Rather than limiting data to mundane functionality, we can take advantage of the opportunity to showcase innovative data visualization projects. To drill down into the data, the health dashboard makes use of GIF images, Tabular, Filters, Actions, and Word Cloud. In Addition, the Sentiment Analysis Dashboard uses Word Cloud, Bar Charts, Dual Axis Charts and Filter Actions.
3. Visualizing Data: Users can visualize the symptoms, diagnosis, treatment, expenses, and FAQ’s in the Health Conditions Dashboard based on the disease they had chosen. It was developed to help patients and their families understand and learn more about the diseases and data used by our chatbot. Furthermore, the Sentiment Analysis Dashboard is intended to help doctors and medical administrators gain a better understanding of the experiences of patients and the general public when they visit hospitals.
4. Glimpse of the Dashboard:
Link to the dashboard: HealthBot \| Tableau Public and Dashboard Demonstration Video
5. About the Dashboard:
-
Visualizes data specific to Indian demographics.
-
Gives an Insight into a particular disease by showcasing its attributes.
-
Highly scalable and Easily Updatable.
The Health Conditions Dashboard: “An Overview of the Disease data used by our MediBot”: It helps to give an insight to the users namely patients, family members of the admitted patients and the healthcare management about the data used by our Chatbot.
The Sentiment Analysis Dashboard: “To Gauge the patients experiences at Hospitals”: It helps to give an insight into patient’s experiences with the help of sentiment analysis performed on tweets filtered according to relevancy of patient’s experiences and these 6 classes which are as follows :
-
Common Procedures
-
Emergency Care
-
Hospital Staff
-
Medical Facility
-
Treatment
-
Null
In the Sentiment Analysis Dashboard, the sentiment analysis is performed on the dataset built after filtering relevant twitter tweets and then on the basis of it’s sentiment, each tweet is classified into three categories namely :
-
Neutral
-
Positive
-
Negative
6. Data Used in Dashboard Building:
-
For the Creation of Health Conditions Dashboard we utilized the Health-Conditions.csv
-
For the Creation of Sentiment Analysis Dashboard we utilized two files namely : Sentiment-Analysis.csv and the cleaned_tweets_v1.txt
7. Tools Used:
-
Tableau was used as a dashboarding tool for this project.
-
To represent the data in a meaningful way, we created various worksheets, a dashboard and a story.
-
We Used GIF images to represent the Health Conditions and Sentiments .
-
We also utilized different chart models(Bar Graph, Tabular formats, Dual Axis Charts, Word Cloud, Action Filters to represent the data in an understandable format).
Chatbot Modelling Rasa FrameWork:
We chose RASA to build our chatbot for its versatility and its functionality. Rasa is an open source AI conversational chatbot building tool, it is regularly updated by a huge community of developers and users. Another reason for choosing this modeling tool was to consider the future scalability for practical healthcare application.
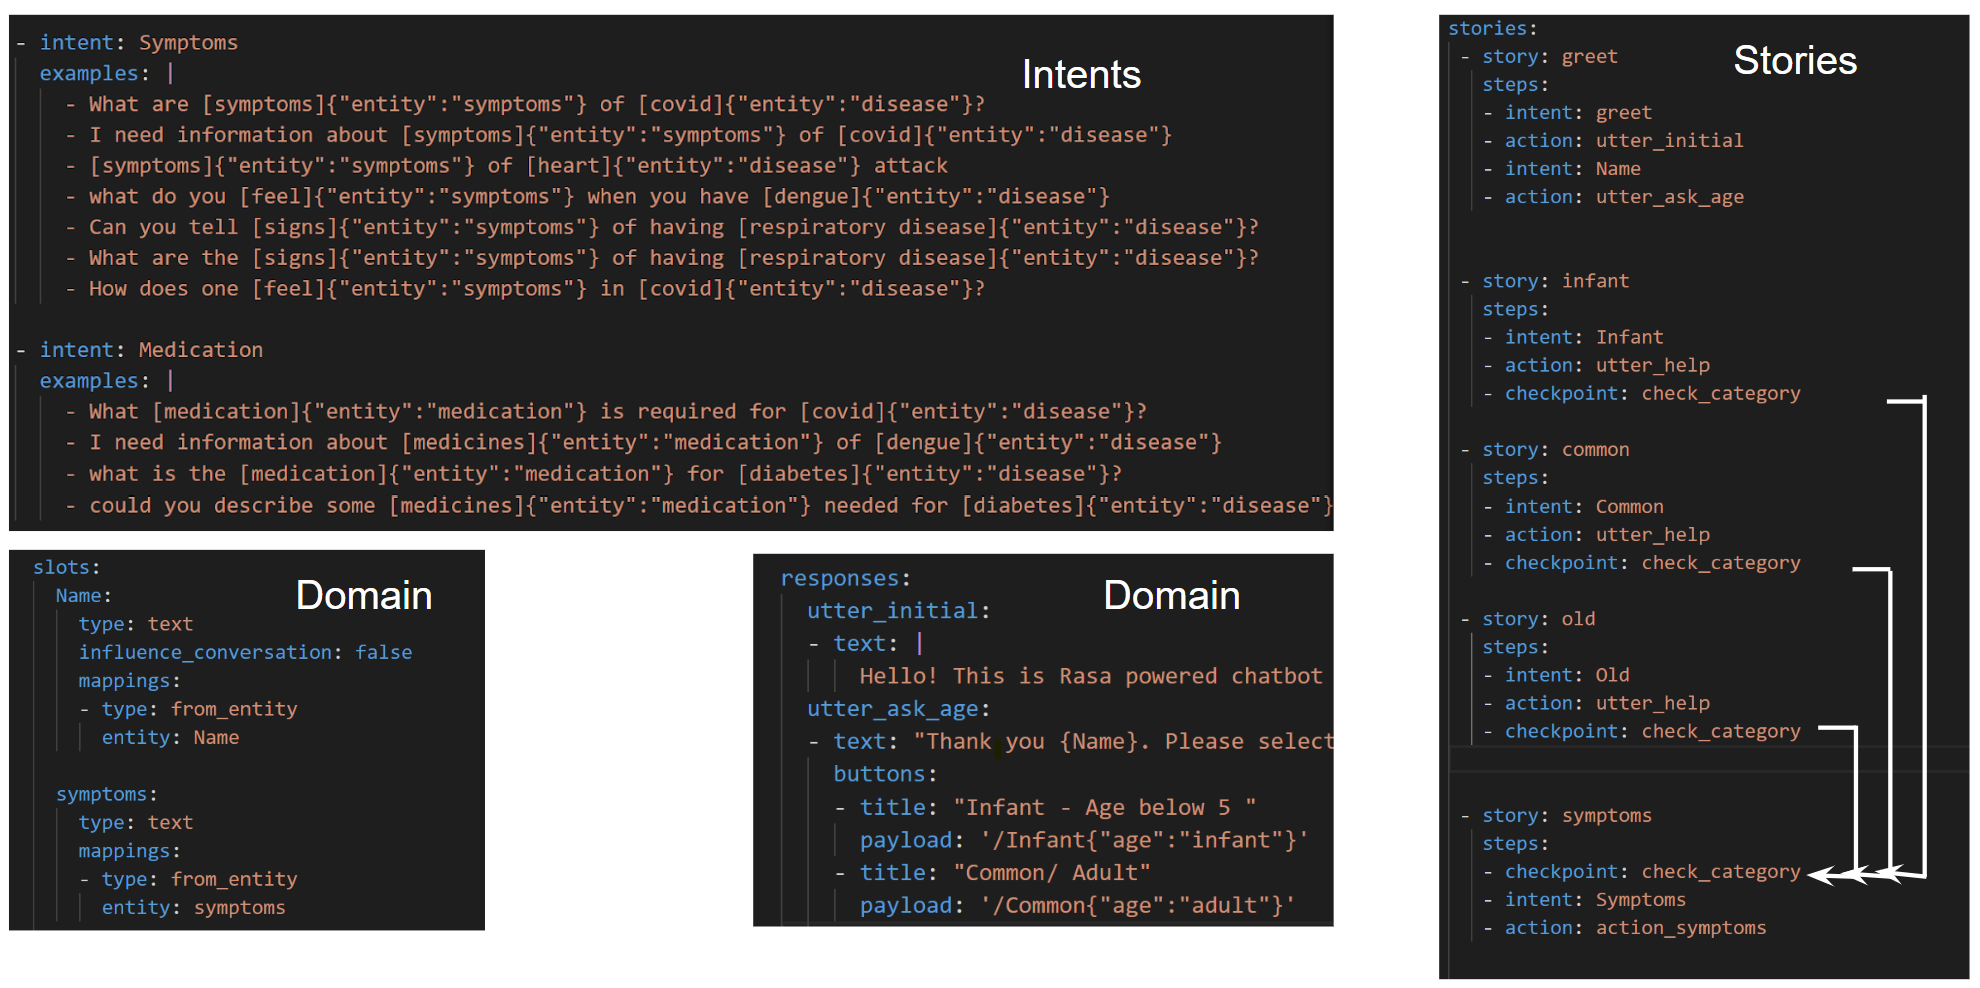
Now, how does Rasa work?
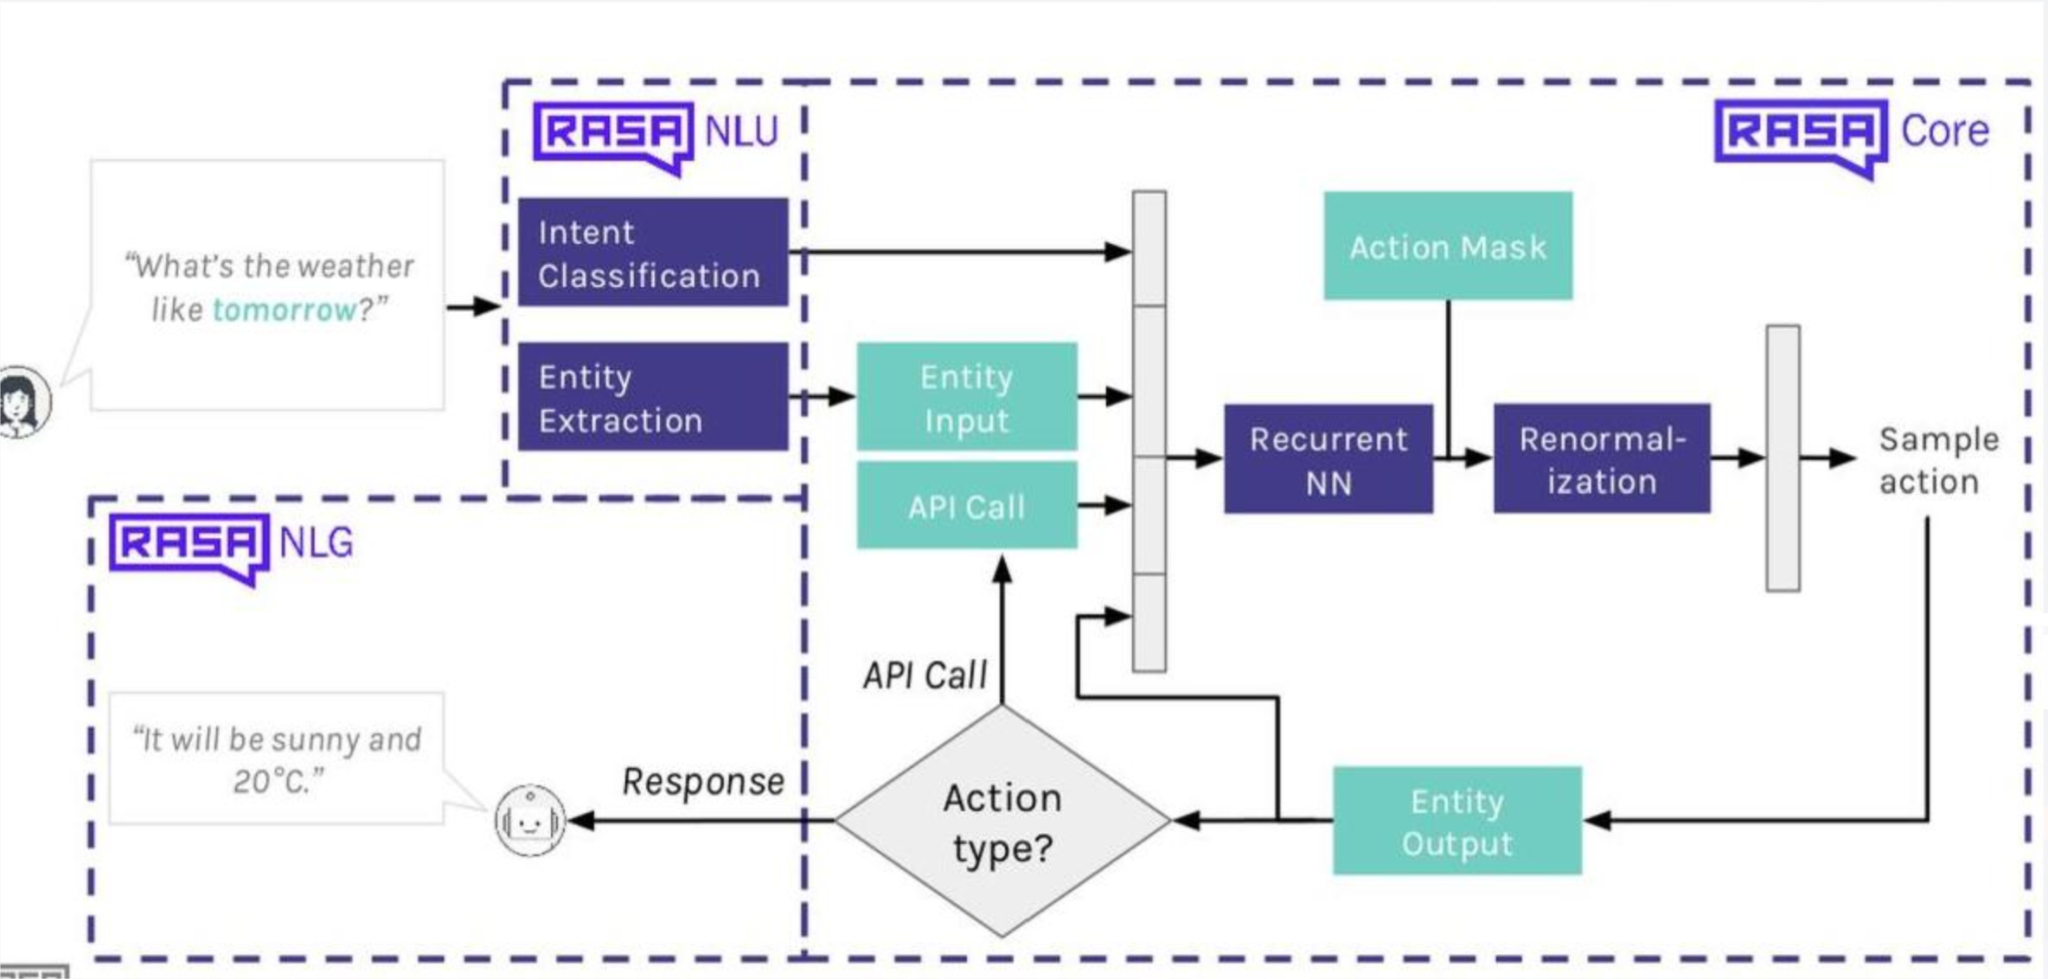
If you did not get a hold of the above image, do not worry, we will take a simple route to understand it. We can say the Rasa structure is divided into three main files - intents.yml, stories.yml and domain.yml.
-
Intents are nothing but examples of user inputs that are hard coded (mostly) so that RASA is trained and is expected to have such messages from the users. A simple intent message could be “Hi”. Entities are collected from the user’s input message and they are stored to be used in the conversation later by the chatbot. For example, when a user mentions a disease name, say Covid, it will capture that name as an entity of ‘disease’ and store it in slots (Rasa slots or storage box) so that name can be used to fetch data or used in the conversational flow.
-
Stories contain a generalized conversational flow between the user and the chatbot. There could be many possibilities of the chat conversation but it can be limited as well as can be made complex by developing stories. Depending on the user’s input message, a story can be triggered to respond to the user’s query. In this project, we have used multiple stories that define a flow of conversation based on whether the user would want to know about Symptoms, Cure, Medication or Expenses related to a particular disease. We have also included Greet and Goodbye sections to make the user feel at home.
-
domain.yml an overseer of this process. It stores all the data of entities, slots, stories, user responses, actions, and even forms which are not used in this project since we are not collecting any user data.
Deployment:
Till now, we have been developing our chatbot locally. But to get to the next stage of development, we need to deploy our assistant and share it with the world. The Rasa stack runs on-premise or on your own cloud account, which means you have choices when it comes to deploying your assistant. The deployment strategy you choose depends on a range of factors : the amount of complexity you want to take on as a developer, hardware constraints and the traffic you expect your assistant to receive. Let’s see some of the method we explored for deployment :
- Using ngrok:
ngrok is a cross-platform application that exposes local server ports to the internet. It offers various advantages as it is easy to use, fast, supports UTP and HTTPS, and also it can be used free.
- Using Heroku and Docker Compose:
Heroku is a container-based cloud Platform as a Service(PaaS). Its popularity has always hinged on its simplicity, elegance, and usability. Docker Compose is a tool for running multi-container applications on a single host machine. The docker-compose.yml file describes how your application’s containers and services should be configured. Docker Compose networks the containers together, allowing the services to reach each other and making it possible to start or stop all containers with a single command.
 The above fig. shows the deployment process of chatbot using ngrok on Telegram channel.
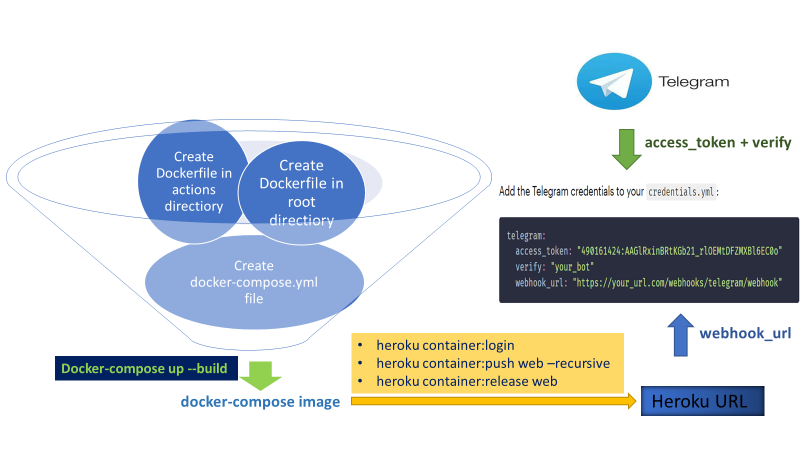 The above fig. shows the deployment process of chatbot using Heroku & Docker Compose on Telegram channel.
Glimpse of the Working MediBot - “An AI chabot at your disposal to answer your key medical questions Quicker!”
Scenario1: Initial conversation
Scenario2: Conversation pertaining to a health related query
Scenario3: Preventative measures and Expenses

Conclusion:
When the three major outcomes of these projects are implemented at full scale, we could see following benefits:
-
The chatbot will help users to get the medical/health related information at their fingertips. They don’t need to wait for the doctors or experts from the health field for the answers to general questions.
-
Additionally, the dashboard will help the users to visualize the health and disease related data utilized by our chatbot in real time. It will also help answer questions related to the chatbot reasoning and will also provide better feedback on patient’s or users behavior to doctors and hospital administration.
-
The sentiment analysis provides us with insights on how user’s emotions are classified as positive, negative or neutral. This will help us determine the level of stress, anxiety and nervousness among patients/users and we will eventually help to reduce it by the first two points discussed above.
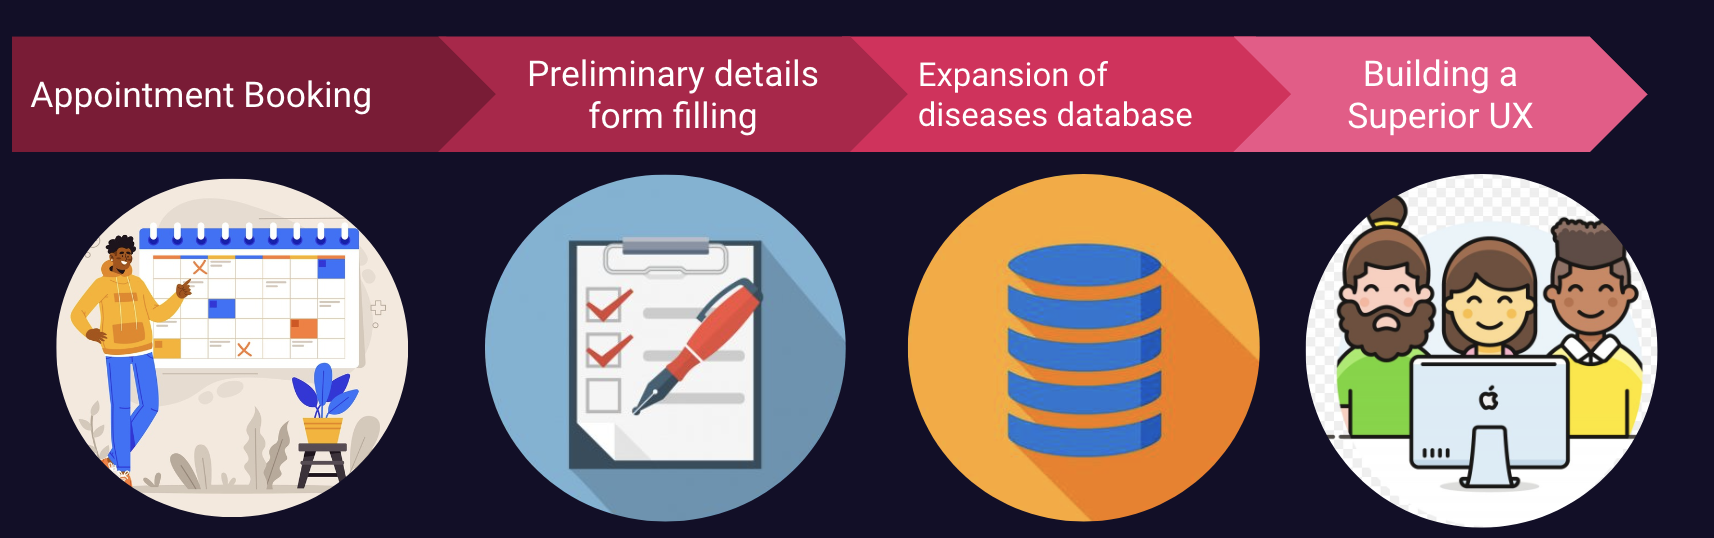
Future Scope:
-
Improving the rasa chatbot by training it on more data, incorporating improved NLU to make it more robust.
-
Incorporate sentiment analysis into the chatbot to respond to patient enquiries based on the sentiment of the preceding remark or query.
-
Adding more databases of diseases and its related attributes to expand the dataset used by the chatbot will help make the chatbot more generalizable in a clinical setting.
-
Improving the dashboard by implementing Age based filters using actions that will change the attributes of the health conditions dynamically according to the age filter selected and will showcase some and hide other features at the time of selection.
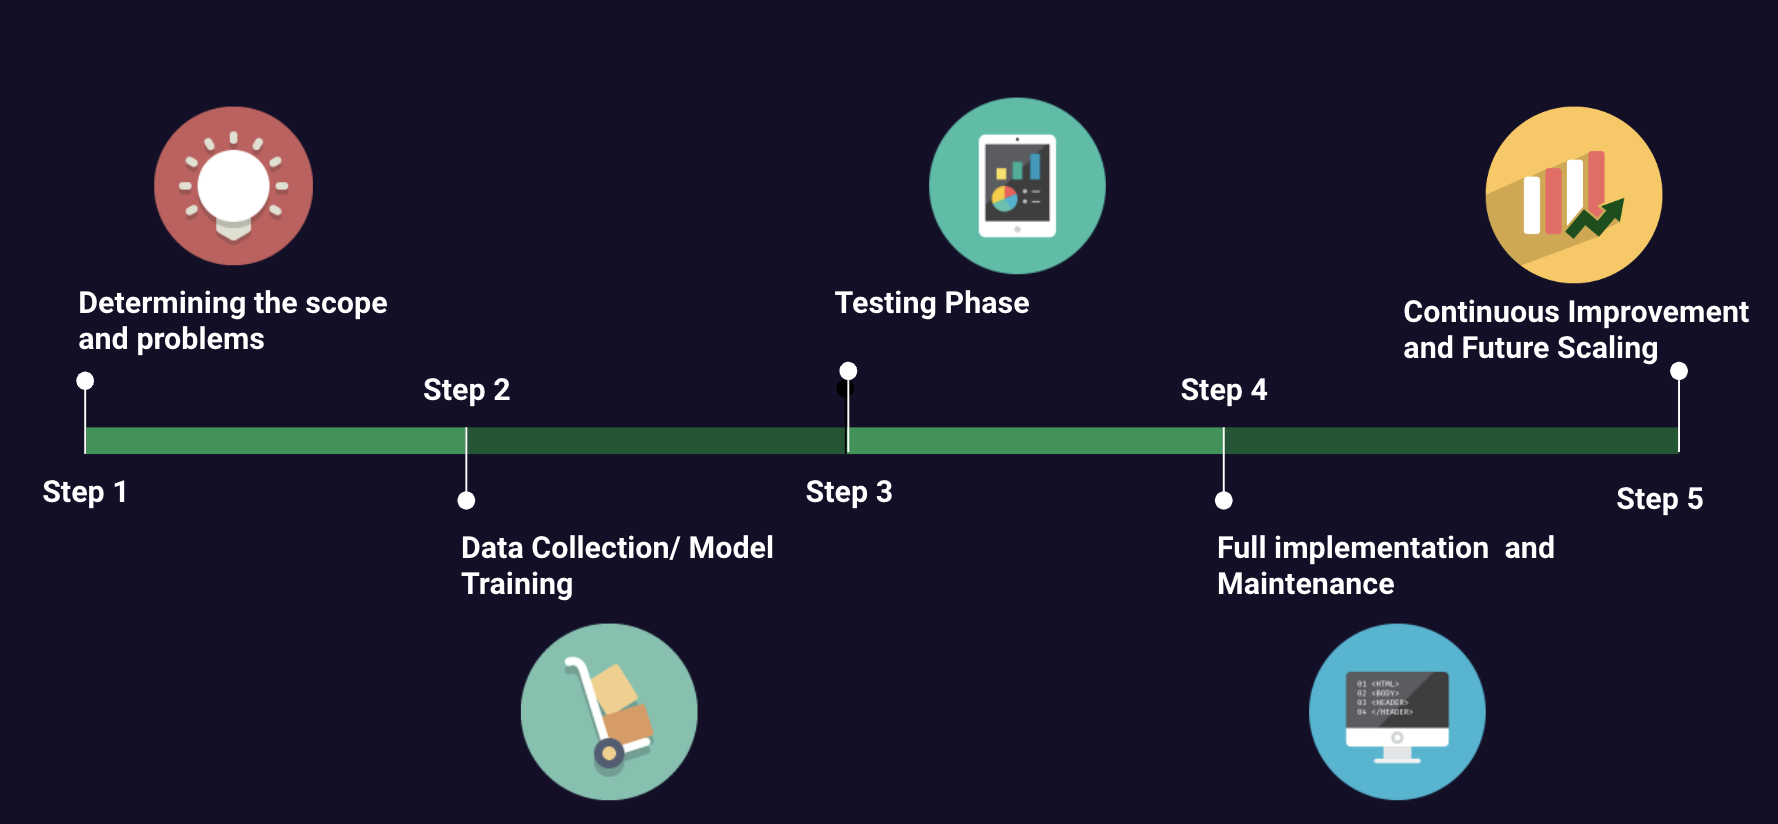
Production Roadmap
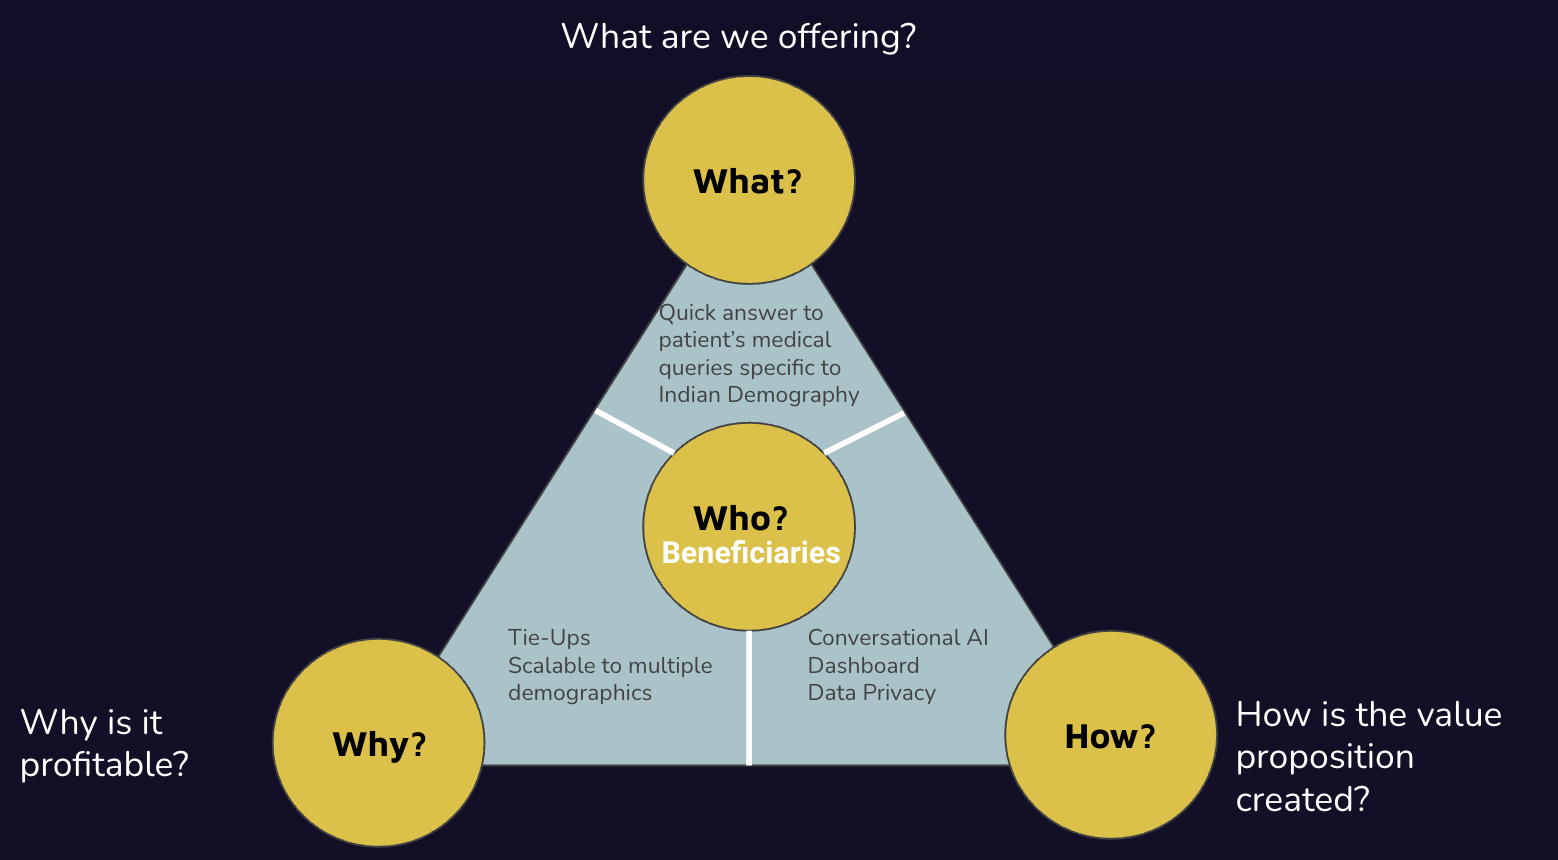
Business Scope and Business Model
Members Involved in the Project:
Team Members: Priyank Negi, Bharati Panigrahi, Hardik Seju, Sudhakar Reddy, Rajat Aayush Jha, Esha Priyadarshi